

When you build a real time ML system, like the one we are building in my live course Building a Real Time ML System. Together, you NEED to see the data.
Why?
Because if the data is bad, your whole system won’t work, no matter how fancy your ML/LLM model is.
This applies to both traditional ML models (aka predictive), or LLMs (aka generative)
Timeout ⌛
I don’t like this predictive vs generative distinction, because it sounds like they are 2 completely different things.
They are not.
LLMs generate their output by predicting the set of most likely tokens to complete the sentence. So yes, generation is essentially a prediction problem.
Anyway, remember the following:
Bad data => Bad models => Bad business metrics => Unhappy boss.You got the point.
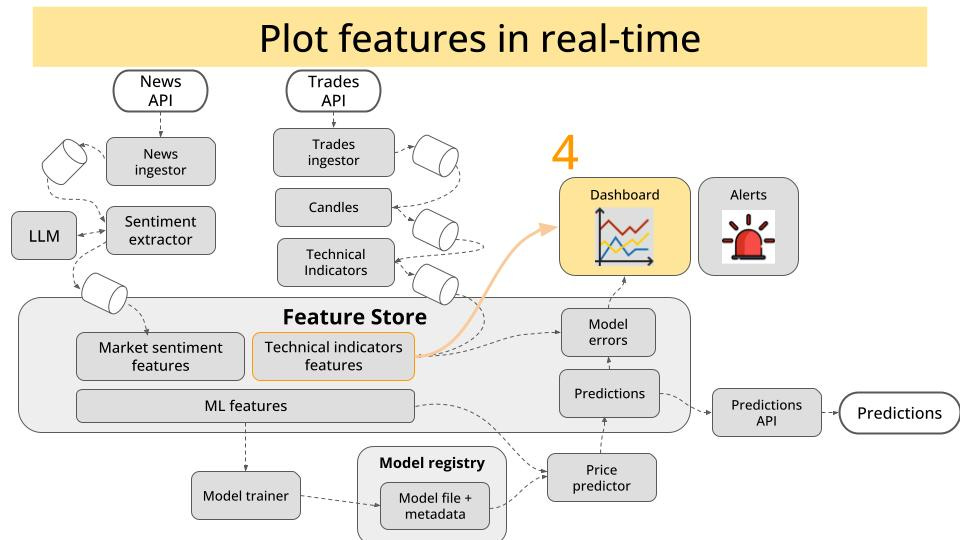
So, today I will explain you how we plan to implement a professional data visualisation and monitoring system for our crypto price prediction system.
So we now the data is good, before we move on to training predictive ML models.
Let’s start!
The tools
We will be using:
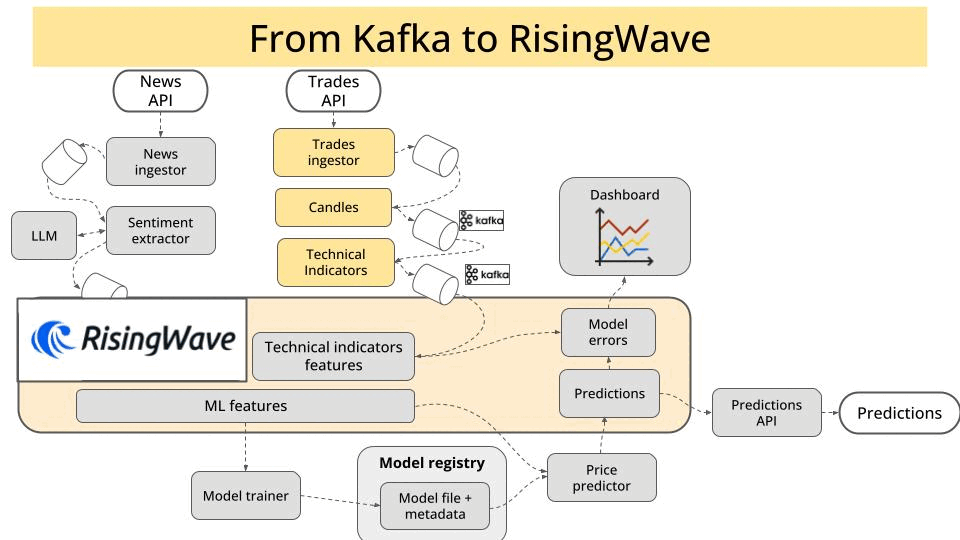
RisingWave as our real time database, that will store the ML model features we want to plot, in this case technical indicators for the whole crypto market.
Grafana to build a super cool real-time candle stick dashboard.
Kubernetes as the platform that runs all these containerised services, both locally (using kind) and on the production environment that our Kubernetes Guru Marius Rugan has prepared.
Let’s go one by one.
Step 1 → Push ML model features into RisingWave
RisingWave is an open-source database built in Rust that can ingest millions of events per second, and transform them on the fly using a Postgres-style SQL syntax.
And the thing is, it plays really well with the super-mega-ultra-powerful message broker we are using in the course: Apache Kafka.
How does that work?
First, make sure your ML model features are saved into a Kafka topic.
From there, you create a materialized view in RisingWave, which acts as a real-time connector from the Kafka topic to table inside your DB.
We will do that in Python, using:
A parametric query template using Jinja, because we want our code and config to be as decoupled as possible.
from jinja2 import Template

sql_template = Template("""
    DROP TABLE IF EXISTS {{ table_name }};
    create table {{ table_name }} (
        pair VARCHAR,
        candle_seconds INT,
        window_start_ms BIGINT,
        window_end_ms BIGINT,
        open NUMERIC,
        high NUMERIC,
        low NUMERIC,
        close NUMERIC,
        volume NUMERIC,
        {% for metric in metrics %}
        {{ metric }} NUMERIC,
        {% endfor %}
        PRIMARY KEY (pair, candle_seconds, window_start_ms)
    ) WITH (
        connector='kafka',
        topic='{{ kafka_topic }}',
        properties.bootstrap.server='{{ kafka_broker_address }}'
    ) FORMAT PLAIN ENCODE JSON;
    """)
The RisingWave python SDK, because it is so easy to use that it would be a sin not to use it :-)
sql_query = sql_template.render(
    kafka_broker_address=kafka_broker_address,
    kafka_topic=kafka_topic,
    table_name=table_name,
    metrics=metrics,
)

from risingwave import RisingWave, RisingWaveConnOptions
rw = RisingWave(
    RisingWaveConnOptions.from_connection_info(
        host=risingwave_host,
        port=risingwave_port,
        user=risingwave_user,
        password=risingwave_password,
        database=risingwave_db,
    )
)

logger.info(f"Executing query {sql_query}")
rw.execute(sql_query)
How do you know the data is there?
RisingWave has a Postgres-like-API, which means you can inspect the data in your DB from the command line using psql.
$ psql -h risingwave.risingwave.svc.cluster.local -p 4567 -d dev -U root

SELECT feature_1, feature_2 FROM your_materialized_view LIMIT 10;
Once we are sure the data is getting there, we will move to the next step.
Step 2 → Ingest data from RisingWave into Grafana
Look, I don’t want you to build yet another Streamlit dashboard that takes ages to load. Especially in a real time setting like this.
We will use instead the right tool for that, which means Grafana.
To integrate RisingWave with Grafana you:
Go to Configuration > Data source.
Click the Add data source button.
Select PostgreSQL from the list of supported databases.
Fill in the PostgreSQL Connection fields using the same service URL port and credentials as you use with the psql command line tool.
Credits go to RisingWave

Super.
We are very close now.
Step 3 → Build and export the candle stick dashboard
We will build one of those green-and-red bar charts that traders use to trade the crypto market (aka candlestick charts).
The only missing thing is to write a simple custom query that makes sure we have a timestamp field, so Grafana does not complain:
SELECT
  *,
  to_timestamp(window_end_ms / 1000.0) AS time
FROM public.indicators;
And BOOM! Real-time data plotted in real-time.

Wanna learn to build real time ML/LLM systems with me?
I am not an AI influencer trying to sell you product X for company Y.
I am an ML/LLM engineer who builds ML systems for a living. And then teaches YOU how to do the same.
No BS.
No Hype.
Just live coding. You and me. From 0 to a fully working system on a production Kubernetes cluster.
So, if you are serious about becoming a top ML engineer, I recommend you join the Building a Real Time ML System. Together adventure.
Next Wednesday we continue building!
See you on the other side,
Pau